
Start
Crypto Tokens (coins), Networks, Transactions, Grypto Gas
Cryptocurrencies are analogs of material currencies issued by independent organizations using blockchain technology. Similarly to real coins, crypto coins or tokens are elementary units of their currencies that can be accumulated in owners' accounts (electronic wallets). Individuals can buy, sell, and exchange crypto coins using their relative market value. Coins also can be sent to and received from different coin owners. A distributed database to control and record these operations (transactions) for one or several cryptocurrencies is called a blockchain or "crypto network." Each blockchain defines one or several standards to create different coins and a specific currency that serves as payment currency for network transactions. This payment currency is also called "network gas."
Examples
1. BitCoin, USDT (Tether), and Ethereum are crypto coins constructed using the ERC-20 standard, are served by the Ethereum blockchain, and the ETH (ERC20) coin is an Ethereum blockchain "gas".
Gas coin examples:
- Ethereum requires ETH (ERC20) for the gas fee
- Solana (SOL and SPL token) requires SOL for the gas fee
- BNB Smart Chain (BEP20) requires BNB (BEP20/ BSC) for the gas fee
- HECO Chain requires HT (HRC20) for the gas fee
Attention: Many networks support coins like USDT(Tether). When transferring coins between wallets, make sure the wallets operate/support the same network, or funds will be lost. Details below:
Crypto wallets
Crypto market basics.
The driving force
A cryptocurrency provides a) an alternative method of payment with a number of benefits (anonymous, faster, and can be cheaper to send/receive or have better liquidity in countries where access to traditional currencies is restricted). Additionally, some specific general-use services (web3 or XPR for SWIFT replacement) can be built on the same blockchain technology that is behind crypto tokens. Thus, we have crypto coin markets simply because exchanging them for traditional currencies is possible. As in any market, this creates a possibility for speculative trading where participants only trade crypto without using its features. In this game, traders with high amounts of assets have a more significant influence on the market. At the end of the day, they collect money from numerous "penny" players (and the more players enter the game - the better). The "penny" players hope to profit during this process by having a relatively small deposit, accurately guessing the market trends, and managing the loss risk - or the same eggs but from the side - via collecting money from less smart peers. This situation creates a market for crypto exchanges, market analysis tools, and trading advisers/gurus. This note aims to check the difficulty of developing a strategy for collecting fellow trader's money using only technical analysis tools.
Dictionary
A number of essential definitions, a.k.a trading slang.
- trading trend. The slope of the price profile over a given time period.
- long order (long). Buying in the hope of selling at a higher price.
- short order (short). Selling an asset in the hope of repurchasing it when the price is lower. To make sense, this operation assumes that the seller should be able to release
the repurchased asset immediately at the initial sell price. That is why the broker is needed: a trader borrows shares from a broker and immediately sells them, expecting the share price to fall shortly after. If it does, the trader can repurchase the shares at the lower price, return them to the broker, and keep the difference, minus any loan interest, as profit." Broker keeps interest and obtains shares back (thus a double gain for him if the price went up in exchange for the risk of keeping potentially falling shares)
- price volatility. The sum of absolute values of price changes on a bar-by-bar basis over a specific time period.
- trading volume. The sum of absolute values of all transactions over a specific time period. The "up volume" is the sum of all buys, and the "down volume" is the sum of all sales.
- support level(s). The price level(s) corresponding to the maximums of buy orders.
- resistance level(s). The price level(s) corresponding to the maximums of sell orders.
The trading assets - cryptocurrencies (a.k.a tokens)
Bitcoin rules accumulate 50%+ of the dollar amount invested in all crypto. There are also several other coins (altcoins) that keep a significant share of the market - Ethereum, Solana, SUI, UMD, etc. - to check, order by volume at https://www.coinbase.com/advanced-trade/spot/BTC-USD. Low-volume coins fluctuate unpredictably, even on a weekly scale. In contrast, high-volume coins follow the Bitcoin market and can experience stable price growth over extended (up to a month) periods.
Orders and fees
There are 3 types of orders on Coinbase Advance
- Market ( executed immediately at current price)
- Limit (maximal acceptable below current price for buying orders and minimally acceptable above current market price for sell orders)
- Stop limit (for sell orders, the minimal price below the current market to sell if the price goes down )
Note; Coinbase dot not provide simultaneous taker limit and stop-loss order - inconvinient in some situations. There is no automatic trailing stop loss either. Each order incurs fees. Fees are lower for limit and stop-limit orders, 0.35% on Coinbase Advanced, and higher for market orders 0.55%.
Market analysis tools.
Trading history profiles
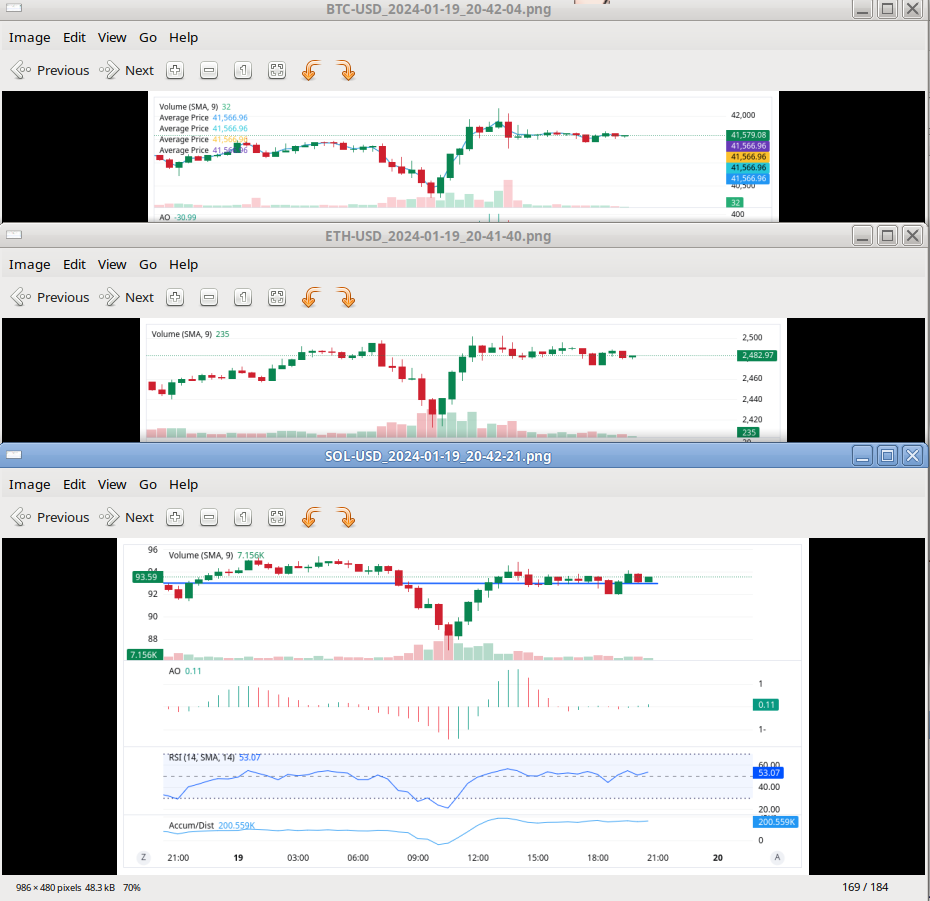
Advanced trade on Coinbase provides a number of tools to estimate the current market status of each coin> The price often fluctuates by 10%+ during a day and up to 100% during 1-2 weeks. Thus, the most critical time frames are"
- 1month/6hrs bin frame to estimate recent market movement for a coin
- 5days/2hrs and 1D/30min frames for daily trading
Depth chart
It may help to estimate the trend based on the total number of buy and sell orders. In short, the green wall on the left indicates support levels (a lot of buy orders below market price, traders think that price will not go down below a certain level; the red wall tells about the price resistance levels that may not be overcome; the symmetry tells that the current trend is neutral. The chart is changed with the market situation.
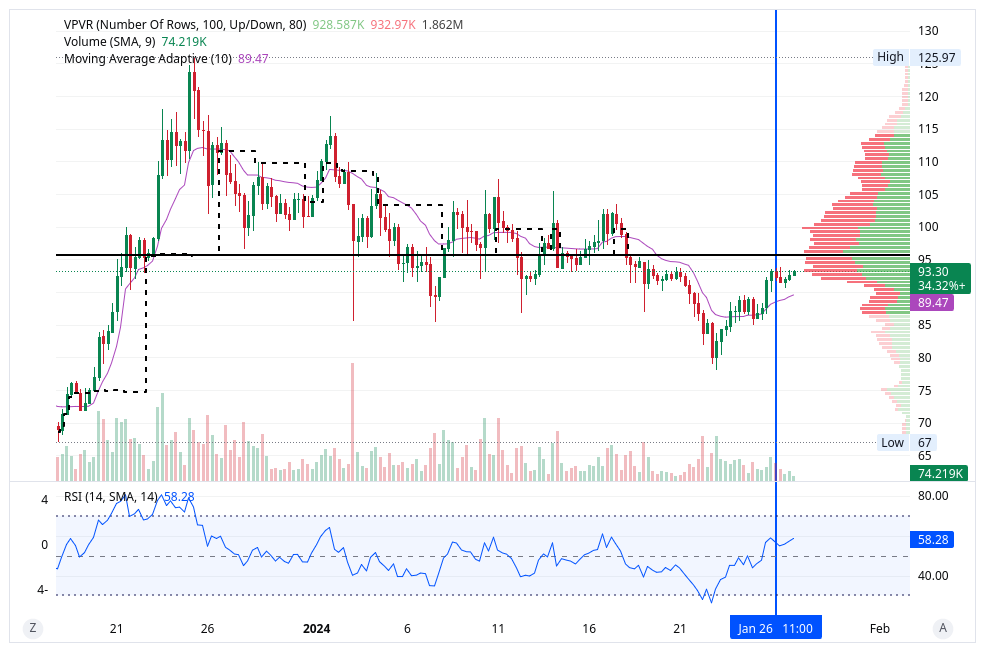
Moving averages (MA)
The Coinbase interface provides a number of "moving average" indicators, calculated as a mean price over a certain number of bins in a timeframe. Sometimes weights are applied to bins - exponential moving average, for example, gives more weight to the most recent bins. On the profile pictures here, the violet line corresponds to the Adaptive moving average, AMS. MA allows 1) estimate the current trend or points of trade changes (if MA is above the price profile, the trend is negative; if below - positive, it crosses the profile, and the trend changes). and 2) estimate the level of stop-loss order on the up-trend long order - the stop-loss right below the AMA is a good guess.
Trading strategy
Things to keep an eye on
- Real Stock (NewYork Exchange) trading hours are 8.30 AM CDT Monday - 3.00 PM CDT Friday. Crypto trading is available 24/7 but tends to be slower in out-of-stock hours.
Friday trends before stock close tends to accelerate, and trading activity rebounds starting Sun evenings.
- Study at least 6 months price movement; find support/resistance levels and time frames of rises/falls between levels
- Analyze the current trend;
- on an uphill trend or at a resistance level, set the "take" target, and stop-loss levels
- on a downhill trend, find the nearest support level and wait for probable trend reflection
- !!! Altcoins (Solana, etc.) are drugging by Bitcoin; check current Bitcoin levels
- The most profitable stock - high-volum altcoin under rising bitcoin.
- What to do with which trend (have not yet tried shorts)
- Flat in an uptrend ( starting 2nd up step) - enter long (buy via limit below ~0.5% of the current level). Exit at target or set stop-loss 3% below target and exit at the next level of support
- Uptrend between levels. Ester (buy) on the spot as soon as possible. Exit at target or set stop-loss 3% below target and exit at the next level of support
- Flat in a downtrend ( on a 3rd+ down steps) - enter short (assuming further price decline). Exit short at the next level of support.
- Downtrend between levels - enter short. Exit short at the next level of support.
Long trade prescription on 24-48 hrs scale.
- 1, Find all support/resistance levels on a monthly fame. If at current maximum wait for a drop to the nearest support level.
- 2. Enter at a resistance level (on a rising trend) but near 0.5% below the current volume maximum. If trading solana check BTC levels,
draw them on the Solana profile. Exit immediately on the next resistance level take profit at the next level volume maximum or +/- 0.25% below, or at 3-4% on a slow rise - better something then nothing
- 3. Do not enter in +/- 2hrs of stock close (4 pm) - allow tend to stabilize.
- 4. Check morning status before/at stock opens (8.30 AM). If near the profit maximum take it.
- 5. Try to exit before stock close. If at profit - take it, if not and flat, set -3% for the stop limit.
- 6. If trade at -3% +3%, then ~70% of trades should be winners to have profit (-.8% for fees)
Entry points in long trades
Choosing the stop-loss level (long entries)
The idea is to set a limit for a possible price decline. If the price does go up, the stop-loss level should be adjusted correspondingly.
There are three (popular) methods you can use to determine where to set your stop losses (assuming we entered at some strong support level): https://www.learningmarkets.com/how-to-determine-where-to-set-a-stop-loss/
- The percentage method
- Set at some fixed percentage level below the current support level, which accommodates support level price fluctuations
- The support method
- On a rising trend, set the stop-loss at the previous (highest) low
- The moving average method
- Set stop loss right below the moving average curve
Trades
Entered trades for Solana on Coinbase 12/21/23
First session
- Timestamp TransType Asset Quantity Currency Spot Subtotal Total(spend/recieved) Notes
- 2023-12-21 18:45:46 UTC Buy SOL 5.074752665 USD 94.75 \
⚠ $480.82 \$500.00 Bought 5.074752665 SOL for 500 USD - 2023-12-25 07:21:56 UTC Buy DOT 10.3252060738 USD 9.31 \
⚠ $96.16 \$100.00 Bought 10.3252060738 DOT for 100 USD - 2023-12-28 09:25:43 UTC Convert DOT 10.3252060738 USD 8.66 \
⚠ $86.68 \$89.23 Converted 10.3252060738 DOT to 0.835169241 SOL - 2023-12-28 21:30:16 UTC Advance Trade Sell SOL 6.057 USD 101.50 \
⚠ $614.79 \$611.10 Sold 6.057 SOL for 611.1 USD on SOL-USD- Attach.Crypto.Start/SOL-USD_2024-01-24_13-58-01-trade1.png

Explanation: Felt "gold fever" due to Solana's rise. Almost entirely blind decisions used Coinbase's minimal interface.
- 1.1) bought Solana intending to keep it "forever" (expected 300% rise in 3 months) like on a savings account. Did not look at local trade timing at all
and did not set take or stop limits. Four days later, the price (magically) raised, add \$100 with PolcaDot, in the mood "I'm a cool trader."
- 1.2) three days later, both SOL and DOT started to decline. I converted DOT to SOL at a 10% loss in hopes of an SOL rebound.
- 1.3) On the same day, SOL price continued to drop below my profitable level, sell all SOL on the spot using the Advanced Trade interface (yes, finally learned
that trading fees are dramatically lower here)
Summary: Spend \⚠ $600 to get \$611 at the last moment (the peak was \$725). Coinbase is not a bank; short (daily-weekly) profit is only possible with trading.
Needs Advanced Tolls to monitor the market. I need to understand the underlying force for price movement.
Second session
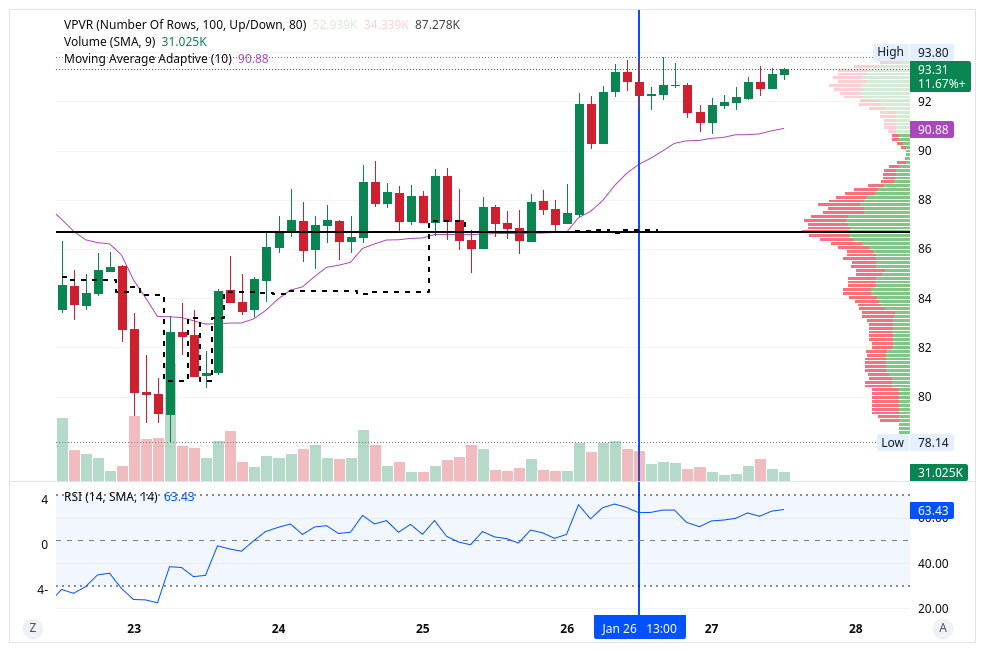
Observed further 10% Solana price decline with four hights around \⚠ $100. Entered trade at \$93.5 with a take limit of 99.20.
- Attach.Crypto.Start/SOL-USD_2024-01-24_13-59-31-trade1-2.png

However, the price went further down(!) instead of rebounding as projected. A big mistake was not to set a stop limit; as a result, sell SOL during sharp fell on the spot in panic. Summary - 11% loss of \$67.44 (609.76-542.32)
- Attach.Crypto.Start/SOL-USD_2024-01-24_15-07-38-trade2-3.png

- 2024-01-18 20:13:47 UTC Advance Trade Buy SOL 6.514 USD 93.05
⚠ $606.13 $609.76 Bought 6.514 SOL for 609.76 USD on SOL-USD - 2024-01-22 19:34:46 UTC Advance Trade Sell SOL 4.178 USD 83.66
⚠ $349.53 $347.61 Sold 4.178 SOL for 347.61 USD on SOL-USD - 2024-01-22 19:34:46 UTC Advance Trade Sell SOL 2.336 USD 83.66
⚠ $195.43 $194.35 Sold 2.336 SOL for 194.35 USD on SOL-USD
Third session
Only now I realized that Solana and other altcoin prices strongly correlate with bitcoin trades, which hold 50+% of the crypto market. Thus, the altcoin prices move with the bitcoin market but under higher +/-20% volatility vs +/- 5% of bitcoin)
- if everything is ok with an altcoin, it follows the bitcoin price with higher modulations
- if altcoin has some features - it rises 2xfaster if bitcoin rises simultaneously
- if altcoin is in trouble - it will eventually go to 0 with temporary highs correlated with a bitcoin price increase
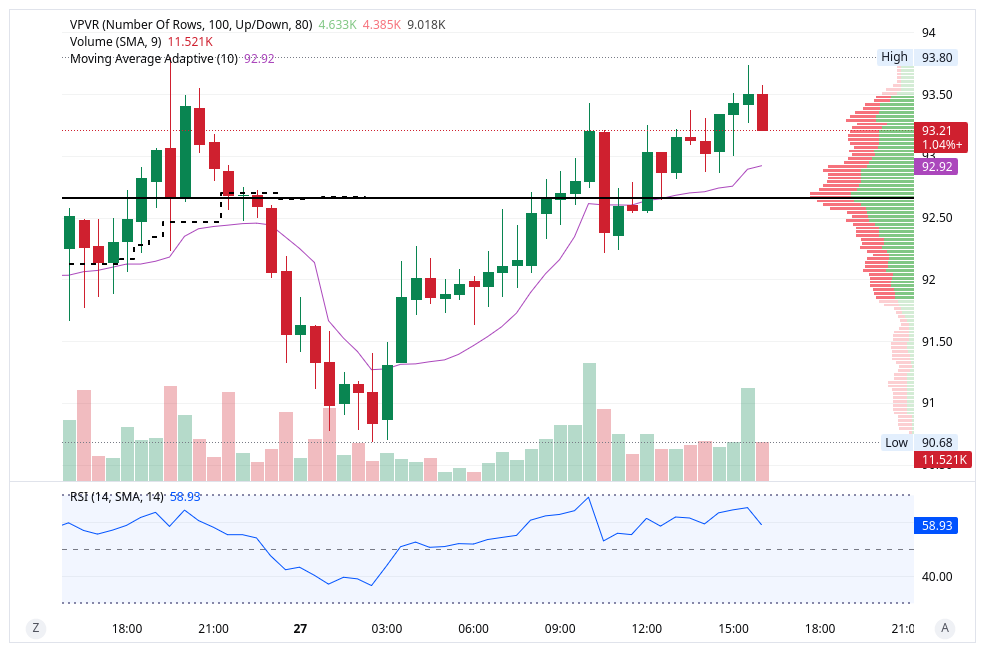
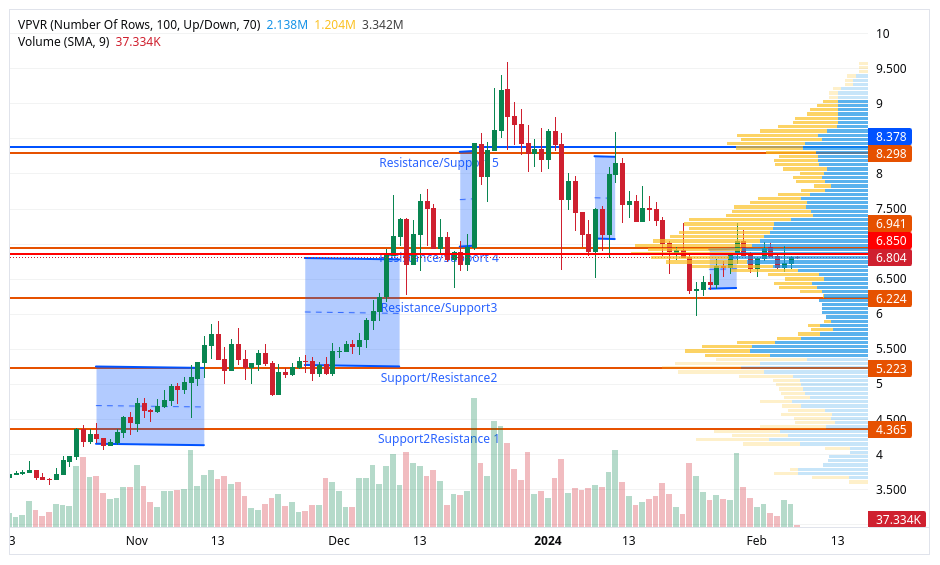
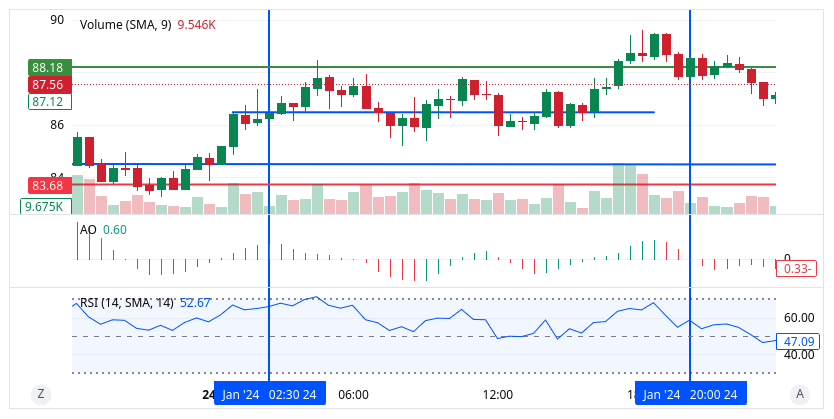
Entered a minimally accurate trade (with the mistake of buying at the market price, at a visual minimum in 1-hour observation interval, instead of via the limit order minus 0.5%) Spend \$541.29 at 86.46. Target is 89.46. The stop-loss is 84.40.
- Attach.Crypto.Start/SOL-USD-trade3.png
- 2024-01-24 08:25:33 UTC Advance Trade Buy SOL 0.0033436227972614 USD 86.46
⚠ $0.29 $0.29 Bought 0.0033436227972614 SOL for 0.29 USD on SOL-USD - 2024-01-24 08:25:33 UTC Advance Trade Buy SOL 4.507 USD 86.46
⚠ $389.68 $391.82 Bought 4.507 SOL for 391.82 USD on SOL-USD - 2024-01-24 08:25:33 UTC Advance Trade Buy SOL 1.739 USD 86.46
⚠ $150.35 $151.18 Bought 1.739 SOL for 151.18 USD on SOL-USD
*2024-01-25 T02:20:10Z Advanced Trade Sell SOL 6.25 USD 88.19 551.19 548.16 3.03 Sold 6.2500 SOL for $548.16 USD on SOL-USD
Result: The price was raised to target, but I misunderstood the "stop-loss" setting, and the sell was not executed at 89.46. The stops 88.20 and limit 88.10 did the job. Profit is only \$5.75, but a good exercise. The detailed documentation is here. https://www.coinbase.com/learn/advanced-trading/order-types. I had to set the stop price (the highest number in the order) as the highest level to trigger the limit order. The limit order price should be a bit lower ( 10-20 cents is ok) to ensure that the sale will occur between the stop price and the limit price in case the stop price is unavailable. The stop-loss order only works if the price is raised above both the stop and limit settings. Possible problems:
- If only a stop price (stop sell) is set, the order will be executed at the highest available price below, which can be substantially below.
- if a stop-limit order is set, it may never be executed if the interval is missed (no available buyers inside) and no price rebound
is expected. If it is expected, the limit price will not be the best to sell, and it is better to cancel the order.
Thus, if the bouncing is probable, the stop limit is better. In this case, the stop level will only convert the order into the "sell above the limit order," and if the stop-limit interval is missed but the price will rebound, then the order will be executed at the limit price.
"Stop-loss and stop-limit orders can provide different types of protection for both long and short investors. Stop-loss orders guarantee execution, while stop-limit orders guarantee the price."
- Coinbase
"Let’s say you’ve successfully bought your 0.1 BTC at the \⚠ $29,000 price. After doing more research, you now believe that BTC could fall below \$25,000 — in this scenario, you’d prefer to cash out of your position rather than wait for prices to rebound. You can set a stop price to sell if it reaches \$25,000 or below.
Adding a limit price of \$24,950 ensures that once the stop price is reached, the limit order if triggered, will execute at that price or higher. This can protect you from trading at an undesired price in a fast-moving and/or low-liquidity market. While your portfolio value would drop, selling your BTC via stop-limit order may reduce further losses if prices drop even lower."
Forth session
I entered at 92.55 at the perfect point (resistance level after 1 level tise from the bottom) via a limit order of 0.5% below the current market price. Price was driven by Bitcoin. Did 3 trailing stop-loss at level of Adaptive Moving Average, or ~2.5% below the current market. The plan was to exit at the next resistance level at ~99. But due to an unexplained local drop at 96.50 level become uncertain about further prise rise and exit at 95.80. Price eventually did rise to 99, and the corresponding limit at 99 would win, but then the price started bouncing between 95 and 98 which is weird. Would it be possible to have simultaneous stop-loss and take orders? I had no problems. Result: +17 dollars back.

Fifth session
+10